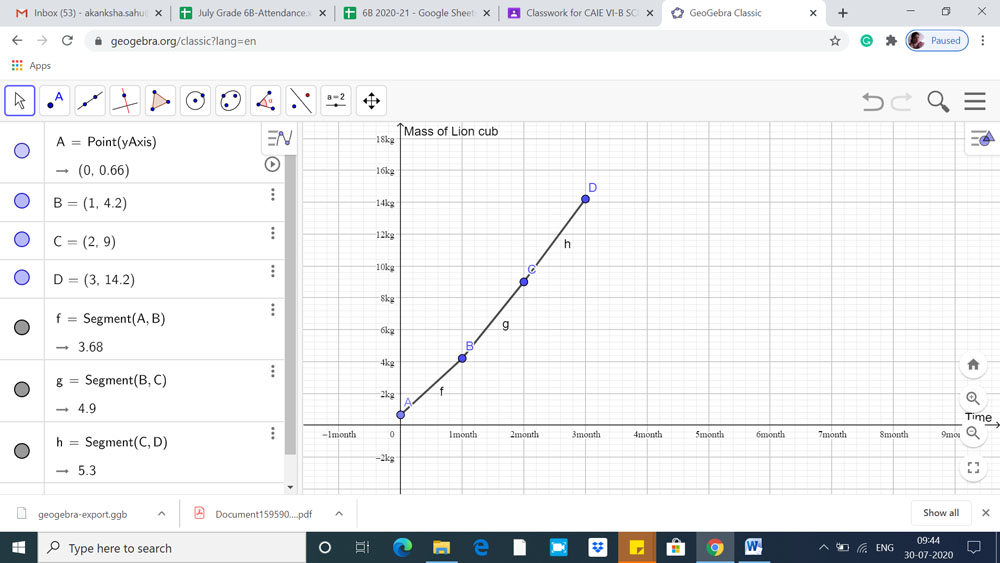
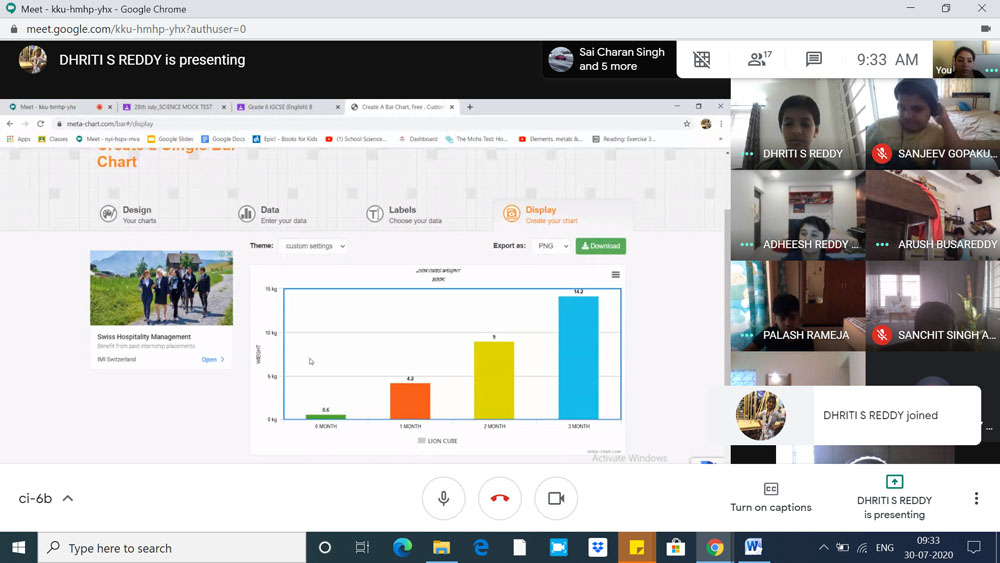
In Cambridge International curriculum, science along with physics, chemistry and biology has an important area of evaluation which is scientific inquiry. Scientific inquiry involves keen observation, raising questions and finding the answers to those questions by performing scientific investigations. While teaching science, the teachers at The Gaudium School focus on conceptual knowledge as well as inculcating the scientific inquiry skills in the students right from Grade six. Students also learn scientific reasoning by processing and evaluating primary and secondary data. Having a basic knowledge of statistical tools is crucial in data handling. Some concepts in science can be understood better if the changes are measured and presented duly. Students are encouraged to learn using and analyzing data in the form of tables, charts and graphs. Being well aware of the limitations of virtual classrooms in explaining such complex topics in class, the team has taken the help of some amazing applications and websites freely available for teachers and students online. The teachers have used an app called Geogebra to make the students understand how to draw and analyze the line graphs. Students also used various features of MS-Excel and Meta-chart app to present the data in the form of tables and charts. Our tech-savvy students came forward and helped everyone to make the classes more effective and meaningful. Someone aptly said-
In learning, you will teach and in teaching, you will learn – Phil Collins


Leave A Comment